Project 1 // Marshalltown, IA.
In 2018, the Mayor of Marshalltown, Iowa declared that transportation was the most critical issue facing the mid-size manufacturing town of roughly 27,000 residents. It had been over a decade since the city’s transit plan had been reviewed and updated, and a new plan was needed to take into account the changing and diverse population and to relocate services to better meet the needs of a modern workforce.
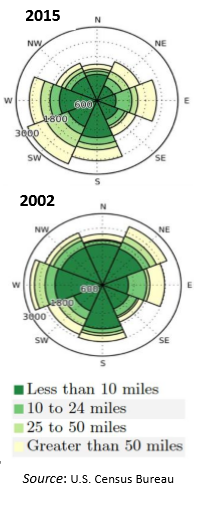 As seen in the figures to the right, over the last decade, more residents began commuting further from home to work, often because affordable and mid-range housing options were not available, pushing residents to live further from the city and their jobs. Over the same time, the percent of residents identifying as Hispanic or Latino nearly doubled from 13 to 24% and city officials anticipated that by the next census, schools in town would have more minority than Caucasian students. The Mayor expected that each of these factors would drive ridership up, however, the Marshalltown Municipal Transit Authority (MMT) was experiencing declining public ridership each year, with a one-year drop of 11%, in 2016, MMT was also experiencing an increasing number of complaints that the public transit system was inconvenient and took too long to travel from one side of town to another for work, school and medical services.
To address the problem of declining and dissatisfied riders, Marshalltown worked together with ISU’s Cooperative Extension System (CES) and researchers from across campus to see how data science and the Community Learning through Data Driven Discovery (CLD3) process could help the City to improve its decision making by accessing up-to-date information about City systems, infrastructure, population dynamics and social interaction. During the Data Discovery phase, a variety of data resources were uncovered;
- Community members identified and shared a variety of administrative data, including housing, existing bus routes and ridership data.
- ISU researchers identified over three dozen additional data sources to be collected (or parsed from PDF reports), imported, integrated, profiled and spatially and statistically analyzed.
- An ISU student rode all of the bus routes in Marshalltown and recorded the routes and locations of each stop using a GPS enabled smartphone and inventory form that allowed for photos and characteristics (benches, lighting accessibility) of the stop to be recorded. This data was then overlaid with current bus routes to identify discrepancies between where the bus actually stopped and the published schedule.
- The sidewalk infrastructure and some street data were incomplete in the GIS provided by the city. To rectify this, the team digitized all sidewalks and any missing streets using OpenStreetMap.
 The data collected in this inventory allowed the team to:
-
Conduct spatial analysis of the accessibility (by sidewalk or street network) to the bus stops. Maps showing the portions of the city (service areas) that were within .25 and .5 mile distance were produced.
-
These service areas where then overlaid on maps depicting the City’s social and economic distributions largely from the Census, identifying the location within the community of populations most likely in need of public transit. These populations included, minority, lower income, elderly, housing units with no vehicle, among others. The produced maps clearly identified areas that would benefit from additional sops or routes in the NE corner of town as well as around a senior living area in the NW part of town.
-
Data was shared with the Mayor’s office and the City’s engineering firm as part of their review of bus stop accessibility. Newly digitized maps of city infrastructure were made publicly available via the OSM platform. Data dashboards were produced to inform the City Council of the bus stop and other non-transportation related issues, suggesting that the benefits of this project will continue to grow as the city utilizes pilot data to inform other strategic decisions.
-
Marshalltown’s Transit administrator used the results of this study to support a plan for new bus stops that better meet the needs of residents, particularly those who face disadvantage.
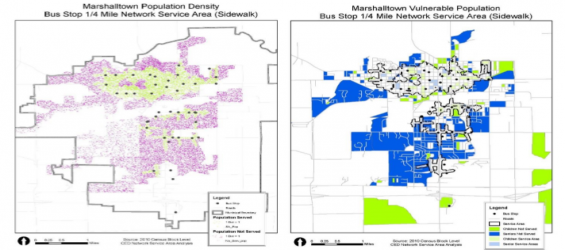
Two examples of the dozens of maps provided to Marshalltown as a result of this project are illustrated above. Left: Bus stop service area and sidewalk availability by population density identifies barriers to use for all residents as well as those who require sidewalk access (i.e. special needs residents). Right: Bus stop service area and sidewalk availability by children’s and senior’s access identifies barriers to use among vulnerable populations.
Jessica Kinser, City Administrator for Marshalltown, reflected on working the ISU team and the CLD3 process in an interview:
“I haven’t worked with any ISU research teams in the past, so I didn’t quite know what to expect. They were well versed in what data was available to them to help us get to a better understanding of the issue. They were patient and willing to help as we worked through struggles of what data we did or did not have on the City-side of things...The mapping definitely helped identify areas that were being underserved, and Kevin Pigors, our Transit Administrator, has been working to address those areas…(This was) a big lesson in my view that you need to have the right people in the right positions to champion and support using data to make decisions.”
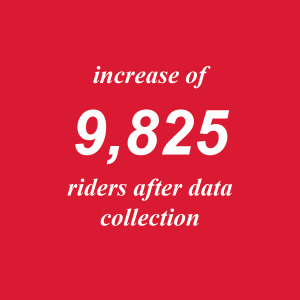
At the conclusion of the CLD3 project, Kevin Pigors, Marshalltown Municipal Transit Administrator and his team received the Federal Transit Authority Award of Excellence and the Iowa Transit Authority Award of Excellence for Highest Percentage Increase in Ridership Among Rural Transit Providers (11% or 9,825 riders). Iowa State University Extension and Outreach also was recognized by the National Association of Community Development Extension Professionals as the 2020 regional winner and national runner-up for Innovation and Creativity in Outreach. The project team included Christopher J. Seeger, Cass Dorius, Erin Mullenix, Bailey Hanson, Austin Dunn, Rakesh Shah, & Jonathan Sherwood.
Project 2 // Giles County, VA.
Giles County is a rural manufacturing town in Southwest Virginia with a population of 17,000 people. Their annual local government budget is $50 million. Reactive services such as jail costs, court costs, social services, police, animal control and Emergency Management Services make up 61% of their operations budget. Between 2008 and 2016, these costs have sourced more than 33% and despite the various attempts, things only seemed to be getting worse.
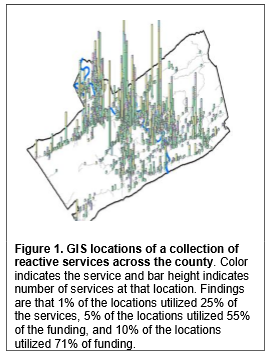 Giles Country decided to take action. They created an initiative called FOCUS (Focusing On Communities Utilizing Services). Utilizing GIS software, they mapped users of 23 different county services. Mapping revealed that 5% of the addresses in Giles County utilized 55% of all the reactive services. Working with a team of department heads from various service- related organizations and their local Cooperative Extension agent they utilized these data to determine areas where proactive services are needed most and deliver these services to the door of the user. The team also enlisted the help of faith-based and charitable organizations and businesses to attack the problem.
As a result of this data-driven approach, Giles implemented several changes to improve the economic mobility of their citizens. For example:
-
Their Day Report Center is an alternative sentencing program for nonviolent crimes which has contributed to a reduction of recidivism rate from 26% to 18% for a two-year span.
-
They created a community service program that allows individuals to pay their court costs through community service, with the goal for individuals to learn accountability, good work habits and self-confidence. This has resulted in an annual increase of 15,000 hours of community service.
-
 Working with Temporary Assistance for Needy Families (TANF) families to find the right volunteer opportunities and eventually jobs and education, as appropriate, leading to a 44% reduction in families on TANF over 2 years.
 -
Families are actively encouraged to use Pre-K opportunities in Giles, which include Head Start Pre-K, Virginia Preschool Initiative, VPI-Plus and a special Early Head Start program. The county continues to add new slots to accommodate more children.
-
They created Access to Community College Education ACCE) Program that provides the financial means for any Giles County Student who graduates from high school to attend NRCC (New River Community College) at no tuition cost to the student. There were 81 students enrolled by the second year of the program.
-
They created a Summer Youth Work Program offering 6-week paid positions and matches the jobs to the interest of students ages 16-19. About 50 students participate each summer. Over 90 local businesses are involved in the program.
Last year the FOCUS team analyzed the current data for these same reactive services. The rates were reduced to the point they were concerned they had made a mistake in their analysis. Based on this approach, Giles County is improving their data-driven approach to enhance the quality of life and economic mobility of their residents. Not only are they achieving these goals, the program has generated a sense of camaraderie among their residents and businesses and also improved Giles’ fiscal situation. Data will continue to be an important part of the planning and implementation as is the growing business participation. As we were hosting data discovery workshops with CES professionals in Virginia, we learned of this example from the Giles County Cooperative Extension agent. Today, this agent is helping another county in southern West Virginia to replicate this data approach.
Project 3 // Roanoke Valley - Alleghany Region, VA.
 CLD3 was an effective strategy for working with the Roanoke Valley - Alleghany Regional Commission. RVARC is one of the 21 Virginia Planning District Commissions. Using CLD3 as our working model, we engaged with RVARC to learn about their issues and formulate questions, used data science techniques to discover, acquire, and statistically integrate data sources to create a CommunityScape (defined below), and communicated and disseminated our findings to the RVARC and their board.
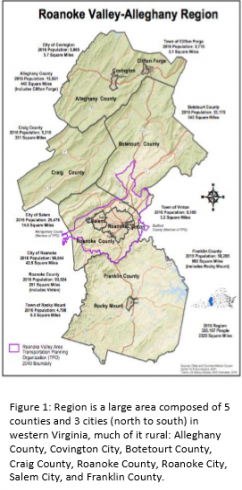
Engage with Community Leaders. RVARC wants to understand the factors that make an area attractive to workers. Despite being located near many universities, few graduates remain in the region. They would also like to attract experienced workers from other areas and retain graduating students and current workers by improving their economic mobility. The RVAR Region is a large area composed of 5 counties and 3 cities in western Virginia, much of it rural (see figure 1).
To identify attributes that could attract workers, Virginia Cooperative Extension professionals worked with one of our Data Science for the Public Good (DSPG) teams composed of professors, students and county officials to create a CommunityScape at the sub-county or sub-city level by Magisterial/voting districts. A CommunityScape brings together social, economic, health and well-being indicators at the sub-city or sub-county (neighborhood) levels to define potential regional attributes on a topic of interest, in this case, attractiveness.
Discover and Integrate Data Sources. The first step is to identify relevant local data to support the study. This is done through a structured data discovery process described in Appendix 1.This data map was created and used to guide data discovery for this research (see figure 2). It highlights the units of analysis and kinds of data needed to create Attractiveness Indicators based on local knowledge and literature reviews. These data characteristics include workforce challenges, community metrics, workforce training opportunities and transportation options.
Statistical Learning. We created synthetic data using American Community Survey (ACS) to create summaries and micro data controlling for age, income, race and poverty using a full Bayesian model that captured the multivariate distribution of these variables. We can aggregate the synthetic data over multiple imputations to compute summaries and margins of error by the new geographic boundaries of interest. For this project, we computed summary statistics by the 48 County Magisterial Districts/voting districts. Attractiveness Indicators are composed of the percent of the population for the following variables.
Transportation:
- Commute Times (< 1 hr.)
- Vehicle Ownership (own a vehicle)
- Public Transportation (public transit is primary means to work)
Housing
- Size of Home (number of bedrooms)
- Type of Home (apartment or house)
- Age of Home (built before/after 1990)
Community:
- Resident Type (renter or owner)
- Family Presence (family or NF household)
- Diversity (% non-white)
- Employment (% employed)
- Active Post Secondary (enrolled in college)
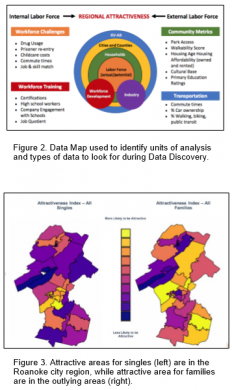 To provide geographic detail at the sub-county and sub-city level, each variable identified in the Data Discovery Process (see figure 2) was ranked across the 48 Magisterial/voting districts in the RVAR area, combined and mapped (see figure 3). The lighter the color (i.e. yellow-gold-orange shaded areas), the more attractive the area is to singles (left) or families (right).
Community Learning. Examining individual variables provides additional insights except for Roanoke City, the only transportation option in the RVAR region is owned vehicle. Most workforce training centers and drug treatment facilities are also located in Roanoke City. Most residents in Roanoke City have access to a vehicle except those near the city center (lighter blue areas, see figure 4). The left hand map in figure 4 is the percent of the population in the city of Roanoke that do not own a vehicle, mostly in the middle of the city where it is possible to walk to stores and work (the light blue area). The right hand map shows where drug treatment (pink) and workforce development facilities are located (blue). Childcare facilities are located throughout the region although most are still located in the Roanoke City area (see figure 5). In figure 5, the left map shows licensed (pink) and unlicensed (blue) child care facilities in Roanoke City. The right map shows the Roanoke City childcare facilities and others located throughout the region.
Creating New Policies. The RVARC is now using this information in their planning. They are identifying transportation alternatives to get the workers to training and to work, providing incentives for more child care and planning new amenities to attract and retain workers in the region.


